ECG findings in Acute Pericarditis
ECG findings in Acute Pericarditis
| EKG findings suggestive of acute pericarditis | acute pericarditis | Myocardial Infarctiom | |
|---|---|---|---|
| 1 | ST-elevation is less than 5 mm | ||
| 2 | ST-segment concavity | ST-segment elevation usually “concave” upward | |
| 3 | More extensive lead involvement | Diffuse ST elevation | ST-elevation related to location of ischemia |
| 4 | Less prominent reciprocal ST-segment depression | ||
| 5 | PR-segment elevation in aVR, with reciprocal PR-segment depression in other leads | PR-segment depression often occurs | No PR-segment depression |
| 6 | The absence of abnormal Q-waves | ||
| 7 | Variability in the time of T-wave inversion occurrence following ST-segment elevation | ||
| 8 | The lack of QRS widening and QT interval shortening in leads with ST-elevation |
Spodick’s sign
Spodick’s sign refers to a downsloping TP segment, best visualized in lead II and lateral precordial leads
ECG findings in Acute Pericarditis – MCQs
ECG findings of Acute Pericarditis
Short-Answer Questions
1. What are the typical ECG changes seen in Stage 1 of acute pericarditis?
– Diffuse ST-segment elevation
– PR segment depression
– Upright T waves
– No reciprocal ST depression (except aVR, V1)
– No Q waves
2. How can acute pericarditis be distinguished from STEMI on ECG?
– ST elevation is diffuse, not localized to a coronary artery territory
– PR segment depression favors pericarditis
– No reciprocal ST depression except in aVR and V1
– No Q waves in pericarditis
– ST/T ratio > 0.25 in pericarditis
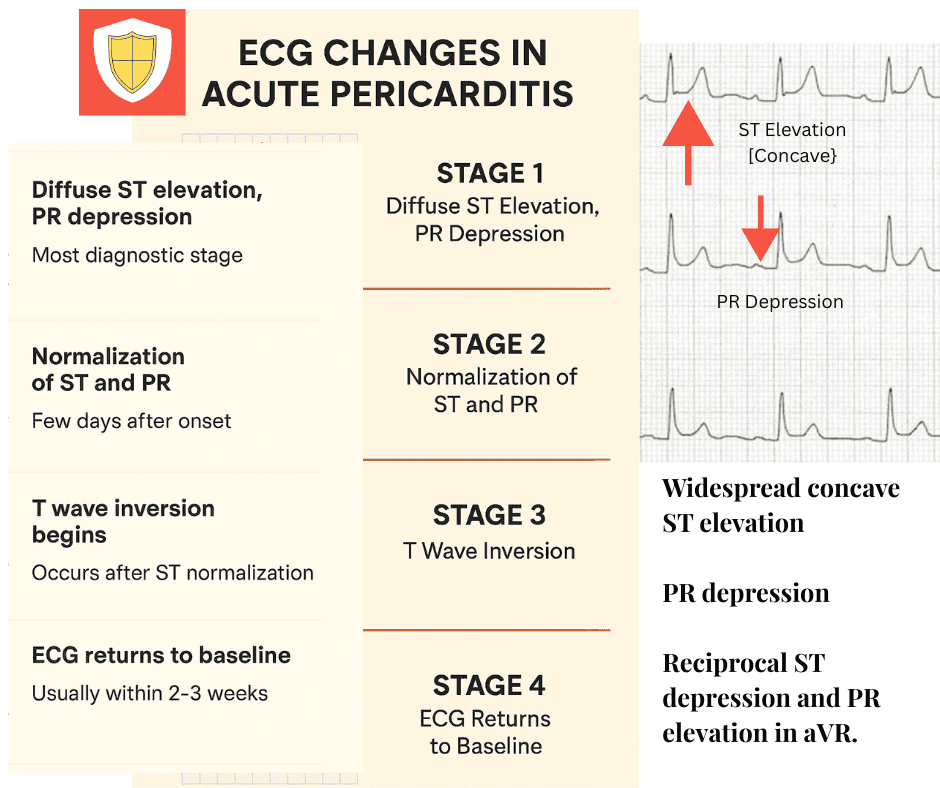
3. Describe the four ECG stages of acute pericarditis.
– Stage 1: ST elevation + PR depression
– Stage 2: Normalization of ST and PR
– Stage 3: T wave inversion
– Stage 4: ECG returns to baseline
– Changes usually occur over days to weeks
4. What is the PR segment abnormality seen in pericarditis?
– PR depression in multiple leads
– PR elevation in aVR and V1
– Caused by atrial epicardial inflammation
– Helps differentiate from STEMI
– Resolves as inflammation subsides
5. Why is the ST elevation in pericarditis called “concave upward”?
– ST segment curves upward like a smile
– Unlike convex (“tombstone”) ST in STEMI
– Suggests non-transmural inflammation
– Diffuse and benign-appearing pattern
– A hallmark of Stage 1 pericarditis
6. How does pericarditis affect the T wave over time?
– T waves are upright in early stages
– Become inverted in Stage 3
– Follow ST segment normalization
– Do not correlate with ischemia
– Eventually return to baseline
7. What is the significance of the aVR lead in pericarditis?
– Shows reciprocal PR elevation
– May show ST depression
– A clue to diffuse inflammation
– Helps distinguish from ischemia
– Not a primary diagnostic lead
8. Which leads typically show the most prominent changes in pericarditis?
– I, II, V5, V6
– Limb and lateral precordial leads
– Reflect pericardial surface inflammation
– ST elevation and PR depression evident
– Diffuse distribution pattern
9. What ECG finding suggests pericardial effusion rather than pericarditis?
– Low voltage QRS complexes
– Electrical alternans (if tamponade)
– No ST elevation or PR depression
– Alternating QRS amplitude
– Indicates swinging of heart in fluid
10. When does normalization of ECG occur in pericarditis?
– Over days to weeks
– Stage 2 shows initial resolution
– Stage 3 has T wave inversion
– Stage 4 is complete normalization
– Depends on inflammation control
| Feature | Acute Pericarditis | Notes |
|---|---|---|
| Stage 1 (Early) | Diffuse ST elevation (concave) + PR depression | Most diagnostic stage |
| Stage 2 | ST and PR segments normalize | Few days after onset |
| Stage 3 | T wave inversion begins | Occurs after ST normalization |
| Stage 4 (Late) | ECG returns to baseline | Usually within 2–3 weeks |
| ST Segment Morphology | Concave upward (“smiling”) ST elevation | Differs from convex ST in STEMI |
| Distribution of ST Elevation | Diffuse (I, II, aVL, V3–V6) | Not limited to a coronary artery territory |
| PR Segment Changes | PR depression in most leads; PR elevation in aVR, V1 | Reflects atrial epicardial inflammation |
| T Wave Changes | Upright in early stages; inversion in stage 3 | Does not indicate ischemia |
| Q Waves | Absent | Helps distinguish from STEMI |
| Reciprocal ST Depression | Typically absent (except in aVR, V1) | A clue against STEMI |
| Lead aVR | PR elevation ± ST depression | Reciprocal to pericarditis changes elsewhere |
| Electrical Alternans | Not typical unless pericardial effusion/tamponade present | Suggests effusion > pericarditis |
| ST/T Ratio in Lead V6 | > 0.25 | Useful quantitative clue |
| Evolution Timeline | Stages evolve over days to weeks | In contrast to rapid changes in STEMI |
| Response to NSAIDs | ECG improves with anti-inflammatory therapy | Diagnostic and therapeutic implication |